

1. 지도 차트 만들기
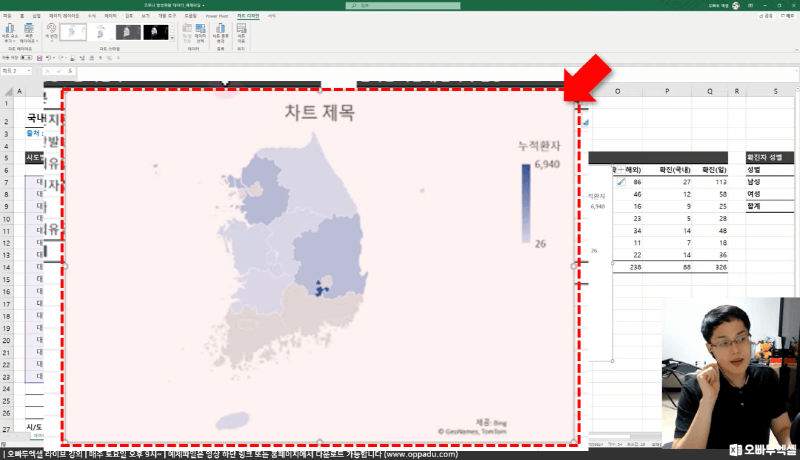
엑셀 2019 이후 버전에서 제공되는 지도차트는 차트 원본 데이터로 올바르지 않은 범위 입력시 일부 지역이 누락되는 문제가 발생합니다.
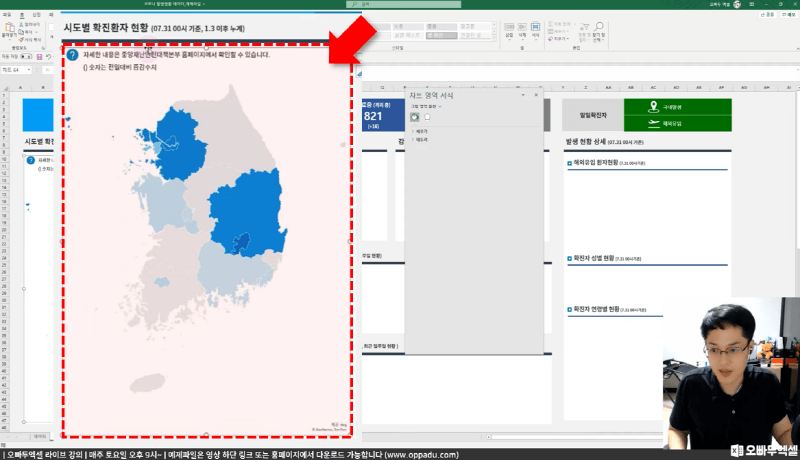
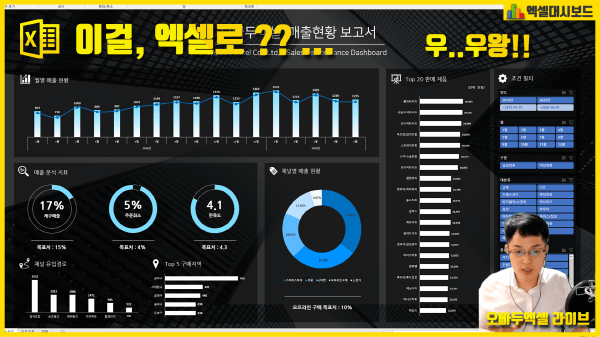
이번 강의에서는 엑셀 지도차트를 활용하여 대한민국 코로나 발생현황 대시보드를 제작하는 방법을 단계별로 살펴봅니다.
2. 시각화 차트 만들기
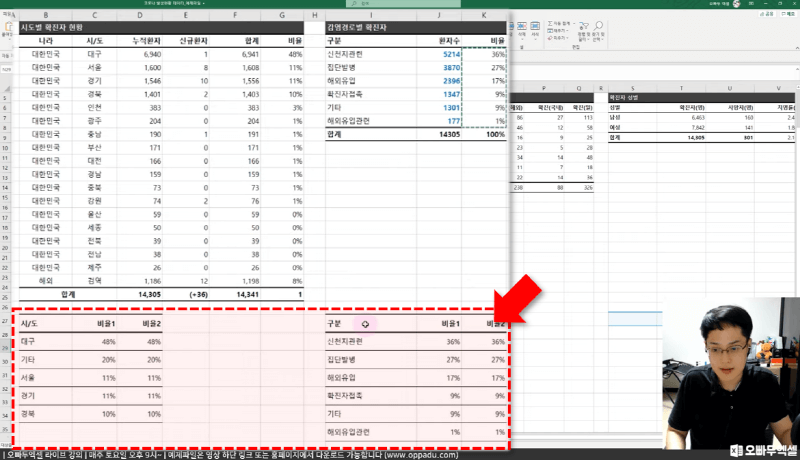
중앙재난안전대책본부에서 받아온 코로나 발생현황 원본 자료에서 차트제작용 데이터를 생성합니다.
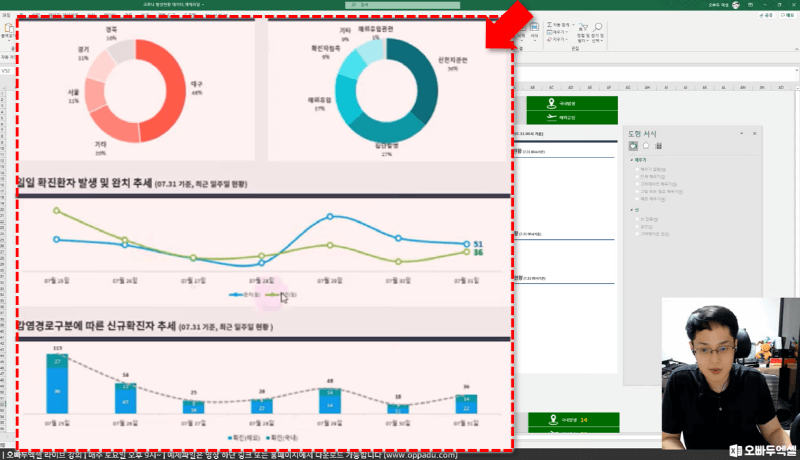
이번 강의에서는 대시보드 차트 시각화에 사용되는다양한 고급 차트 제작 방법을 단계별로 알아봅니다.
📑 연결된 이미지 생성하는 매크로
Sub CreateLinkedImage()

Dim rng As Range
Dim ws As Worksheet
Dim sFormula As String
Dim pic As Shape

Application.ScreenUpdating = False
Application.Calculation = xlCalculationManual

Set ws = ActiveSheet
Set rng = ws.Range("B2").CurrentRegion '<- 연결된 이미지를 생성할 데이터가 시작되는 셀 주소를 입력하세요

With ws
For i = rng.Column To rng.Column + rng.Columns.Count - 1
.Range(.Cells(rng.Row, i), .Cells(rng.Row + rng.Rows.Count - 1, i)).Copy
.Cells(rng.Row + rng.Rows.Count + 1, i).Select
.Pictures.Paste link:=True
Next

For Each pic In ws.Shapes
sFormula = pic.DrawingObject.Formula
.Pictures(pic.Name).Formula = "='" & ws.Name & "'!" & Trim(sFormula)
Next
End With

Application.Calculation = xlCalculationAutomatic
Application.ScreenUpdating = True

End Sub

라이브 정보
회차
7회
방송일
2020년08월01일
카테고리
멤버쉽 라이브 강의
등급
Plus
커리큘럼
질문 & 댓글 3
스크립트
자막을 불러오는 중...
방금 예제파일이 잘 다운로드 되는 것으로 확인했습니다.
게시글 우측의 '예제파일 다운로드' 버튼을 클릭하셔서 파일을 다시 다운로드 받아 보시겠어요? :)
감사합니다.